Developed a log management and monitoring solution of nginx using Loki, Promtail, and Grafana.


What is Grafana?
Grafana is an open-source data visualization and monitoring tool used to analyze and display metrics from various data sources. It provides a web-based interface that allows users to create interactive dashboards and visualizations, making it easier to understand and explore complex data sets.
What is Loki?
Loki is an open-source log aggregation system developed by Grafana Labs. It is designed to be highly efficient and scalable, specializing in handling high-volume log data from various sources. Loki focuses on storing and indexing log data in a way that enables fast and cost-effective log querying and analysis.
What is Promtail?
Promtail is a component of the Loki log aggregation system developed by Grafana Labs. It is responsible for collecting and shipping log entries from various sources to a Loki server for storage and indexing. Promtail acts as an agent that runs on individual machines or containers and is responsible for tailing log files, parsing log entries, and forwarding them to the Loki server.
What is the difference between Prometheus and Loki?
Prometheus is focused on monitoring and alerting for time series metrics, while Loki is focused on log aggregation and analysis. They are complementary tools that can be used together to gain a holistic view of system performance and behavior.
Hands-on:
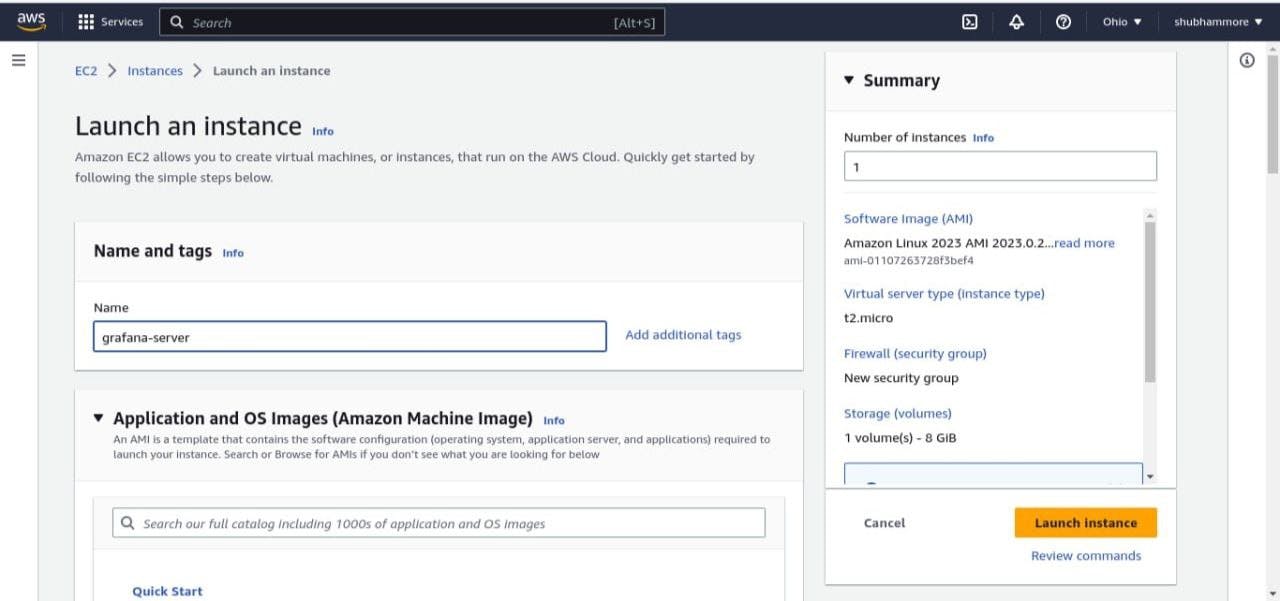
- Launch EC2 instance:
- Install Grafana using the following commands.
sudo apt-get install -y apt-transport-https
sudo apt-get install -y software-properties-common wget
sudo wget -q -O /usr/share/keyrings/grafana.key https://apt.grafana.com/gpg.key
Stable release:
echo "deb [signed-by=/usr/share/keyrings/grafana.key] https://apt.grafana.com stable main" | sudo tee -a /etc/apt/sources.list.d/grafana.list
# Update the list of available packages
sudo apt-get update
# Install the latest OSS release:
sudo apt-get install grafana
- Install nginx using the following command.
sudo apt-get install nginx
- Open port no. 3000 from security group and access the grafana.
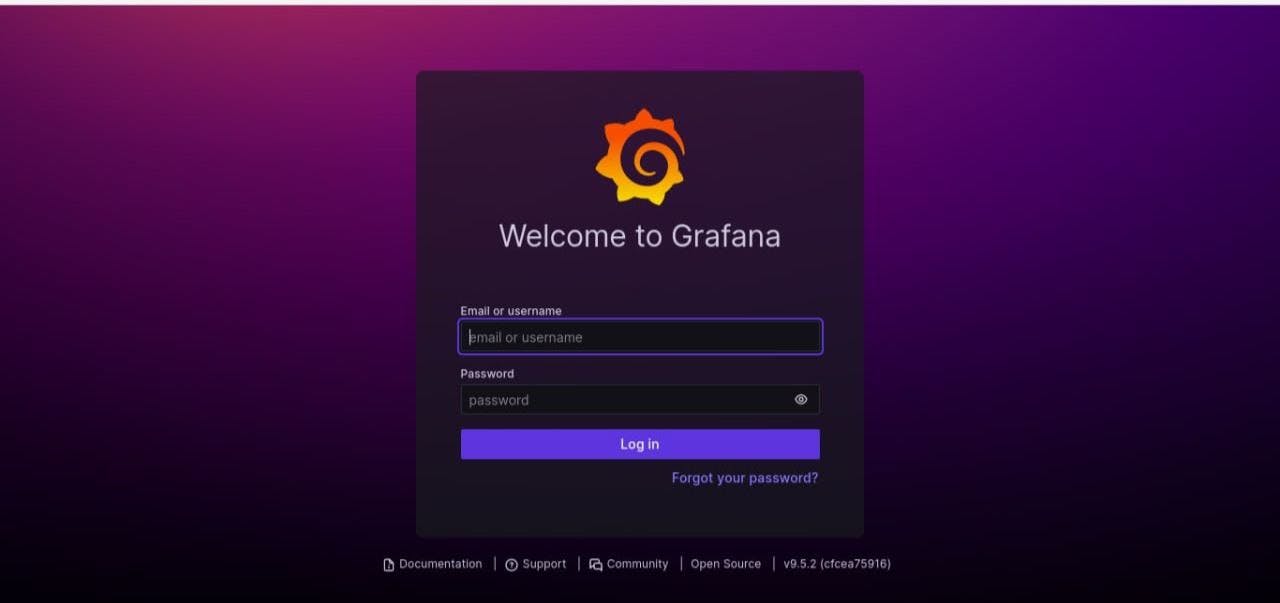
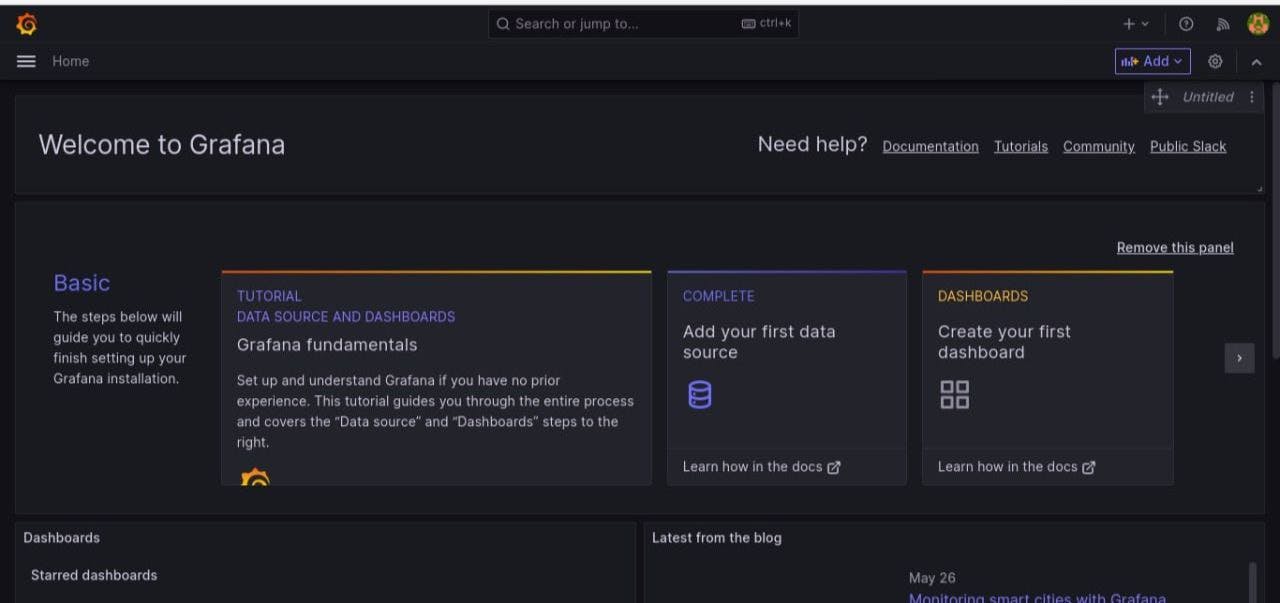
- login with admin as a username and password and login create a new password.
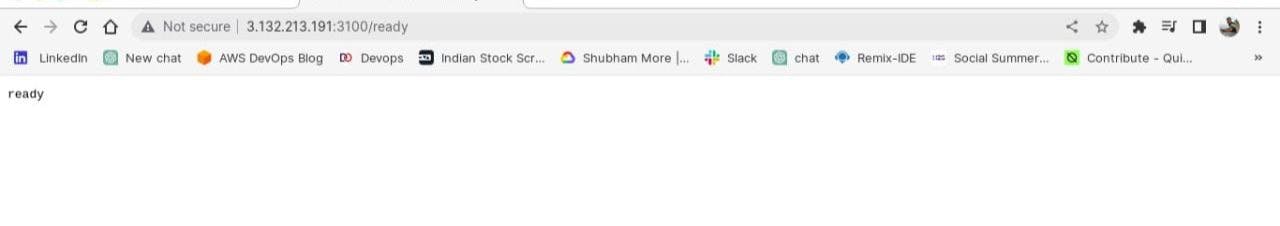
- Create and run a docker container of Loki and access it on port no 3100.
Download Loki Config
wget https://raw.githubusercontent.com/grafana/loki/v2.8.0/cmd/loki/loki-local-config.yaml -O loki-config.yaml
Run Loki Docker container
docker run -d --name loki -v $(pwd):/mnt/config -p 3100:3100 grafana/loki:2.8.0 --config.file=/mnt/config/loki-config.yaml
- Create and run a docker container of Promtail and link it to Loki.
Download Promtail Config
wget https://raw.githubusercontent.com/grafana/loki/v2.8.0/clients/cmd/promtail/promtail-docker-config.yaml -O promtail-config.yaml
Run Promtail Docker container
docker run -d --name promtail -v $(pwd):/mnt/config -v /var/log:/var/log --link loki grafana/promtail:2.8.0 --config.file=/mnt/config/promtail-config.yaml
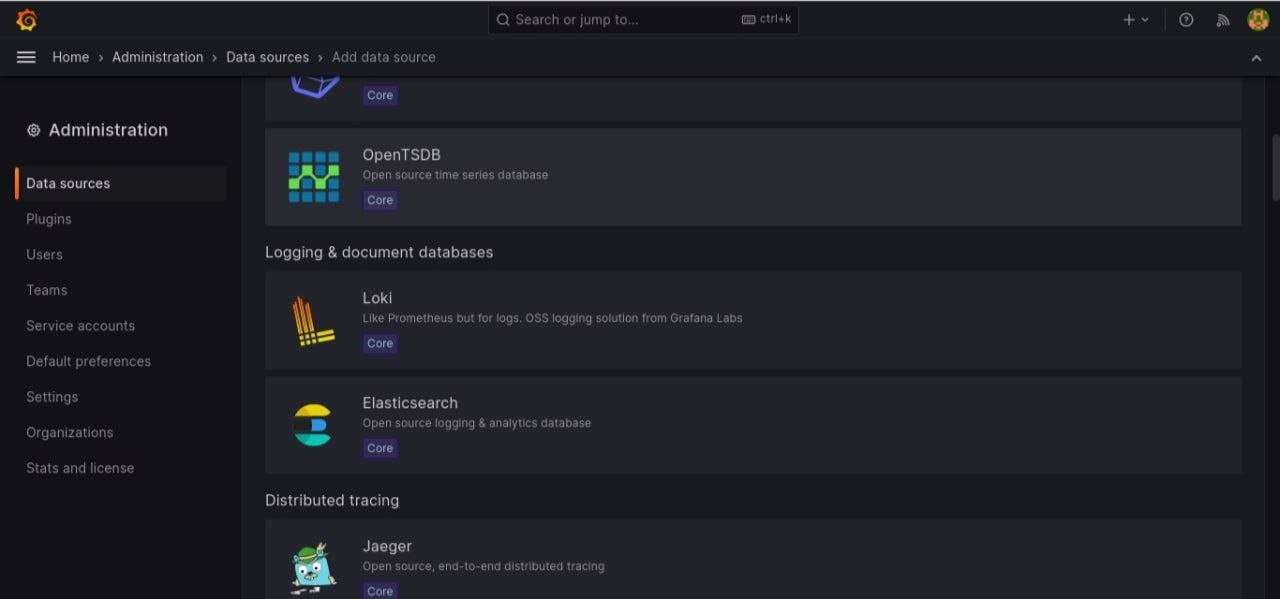
- Adding first data source.
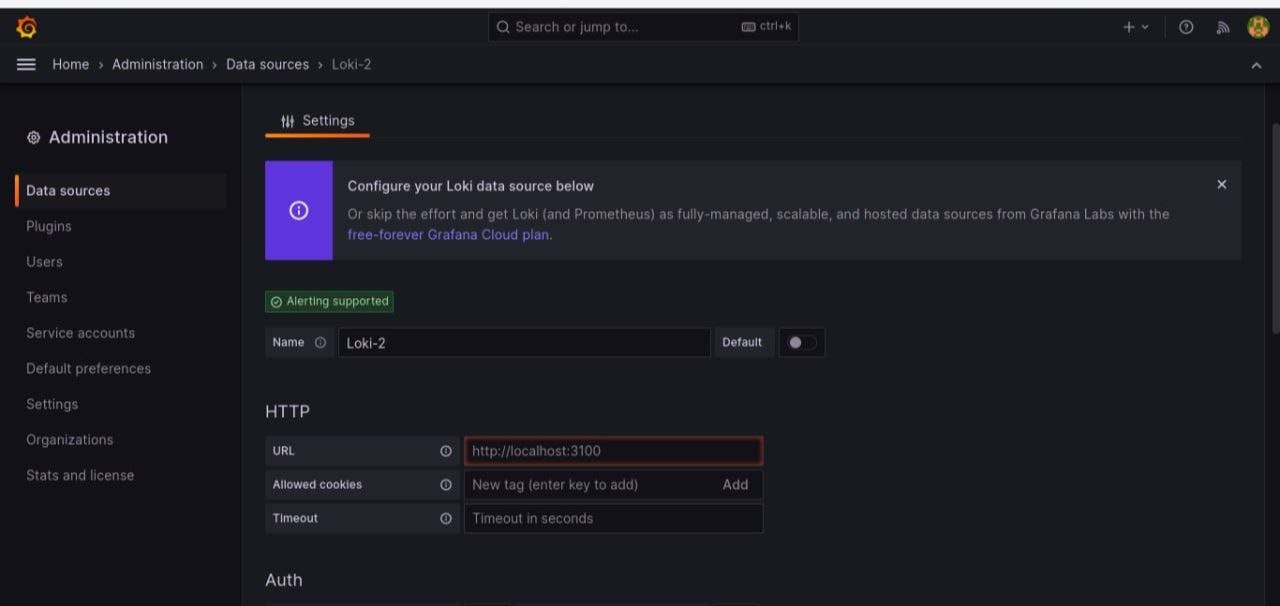
- After that click on Loki and enter the HTTP URL as a URL of Loki in it and click save&test.
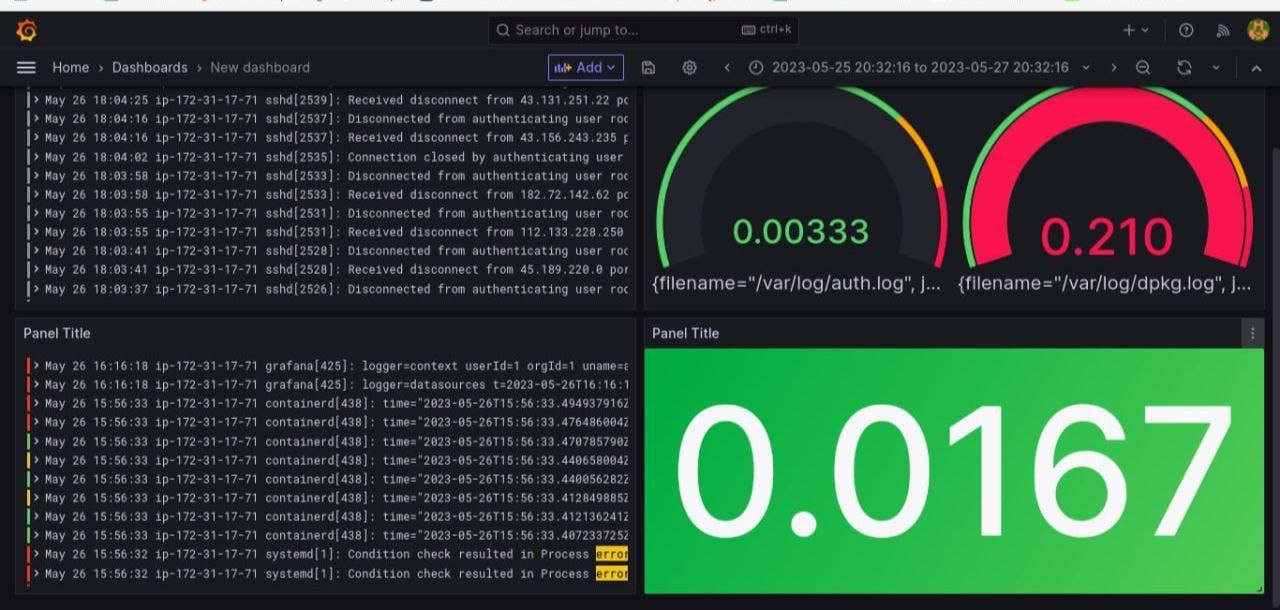
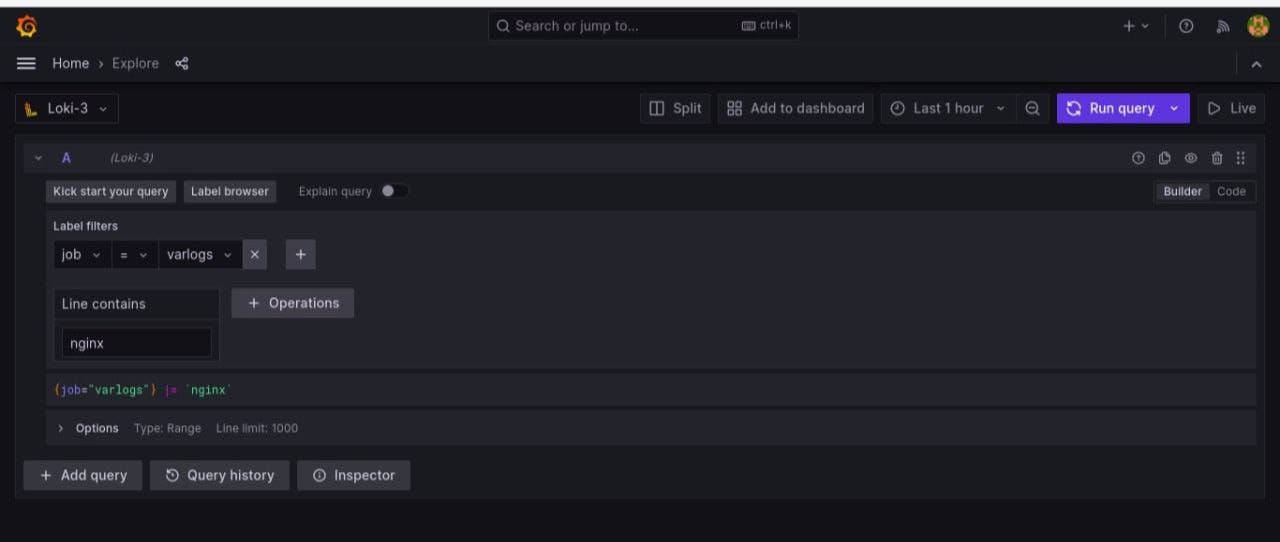
- Then click on Explore to see all the logs and select label as job, select value as varlogs and line contains as nginx according to promtail config.
- After this click on the run query and click on add to the dashboard to create the dashboard also we can add visualization according to our needs.